Building a DIY Air Quality Monitor with Arduino
Understanding our immediate environment is more important than ever. This project is a simple, DIY air quality monitoring system built with an Arduino Nano and a handful of common sensors. It provides a real-time, localized snapshot of key environmental metrics: temperature, humidity, and general air quality, displaying them on a crisp OLED screen. It's an accessible project that puts environmental data directly into your hands.
The Challenge: Accessible Environmental Monitoring
While commercial air quality monitors are available, they can be expensive or operate as "black boxes." The goal of this project was to create an affordable, open-source alternative using readily available hobbyist electronics.
The key objectives were:
- To interface multiple sensors—both digital (DHT11) and analog (MQ135)—with a single Arduino Nano microcontroller.
- To collate the data and present it in a clean, human-readable format on a compact 0.96" OLED display.
- To translate the raw, abstract value from the gas sensor into meaningful, qualitative assessments such as "GOOD" or "POOR."
Project Showcase: The Final Assembly
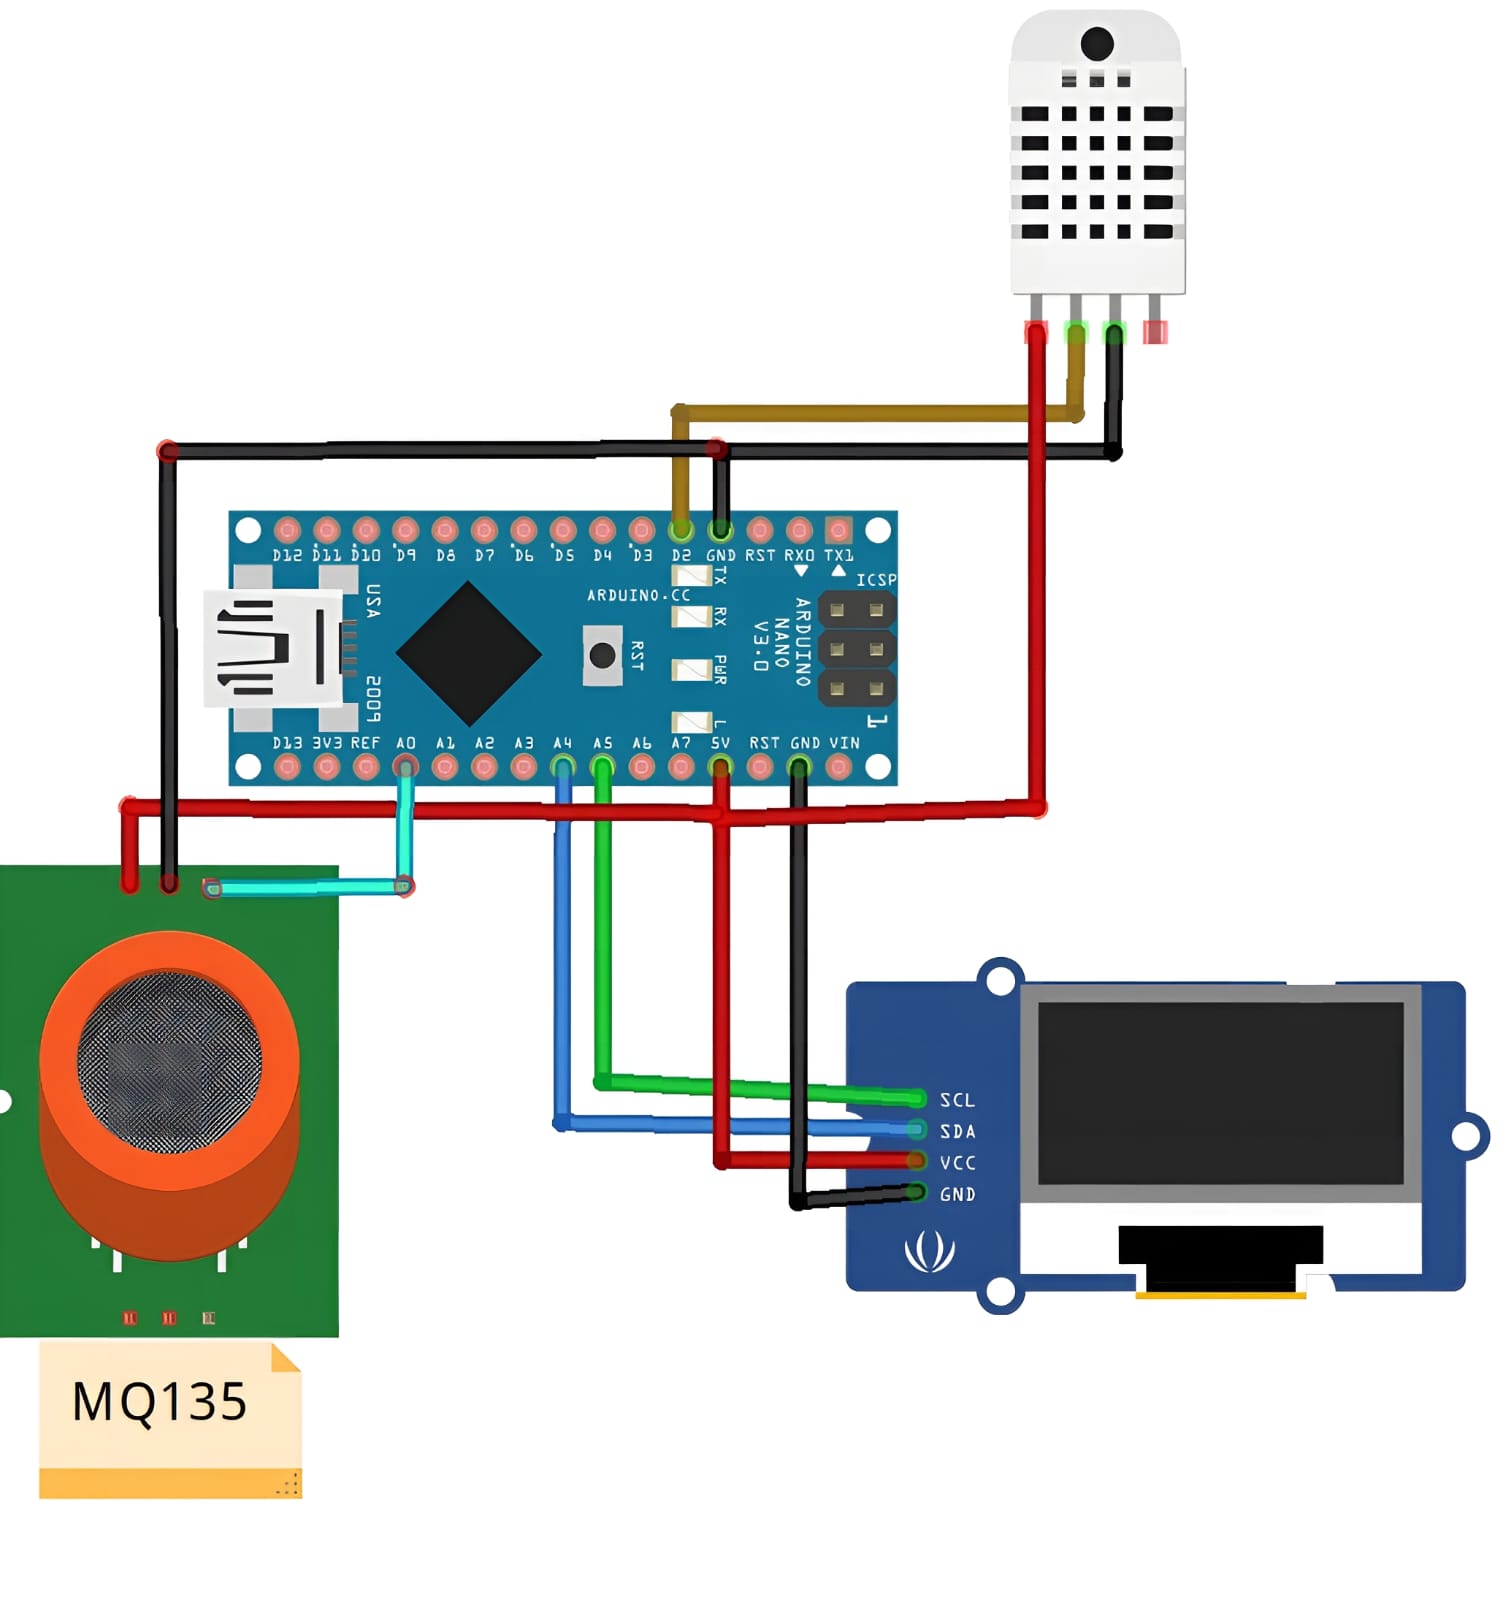
Here is the final assembled air quality monitor, along with its wiring diagram.
Figure: Fianl Assembly:-
 Figure: Wiring Diagram:-
Key Components
- Microcontroller: Arduino Nano R3
- Sensors: DHT11 (Temperature & Humidity), MQ135 (Air Quality)
- Display: 0.96" I2C OLED Display
The Technical Deep Dive: Software & Logic
- Sensor Integration
The software relies on established Arduino libraries to communicate with the hardware. The DHT11 sensor is read using the Adafruit DHT sensor library, which simplifies the process of getting temperature and humidity readings from its single-wire digital protocol. The MQ135 gas sensor provides a raw analog voltage that is read by one of the Arduino's analog pins (A0).
- The OLED Display Interface
The user interface is a 0.96" OLED display controlled using the Adafruit GFX and Adafruit SSD1306 libraries. These libraries provide a framework for drawing text and shapes. To enhance readability on the small screen, the project uses custom fonts for a cleaner presentation of the data.
- Air Quality Logic
The core logic of the monitor lies in interpreting the raw analog value (0-1023) from the MQ135 sensor. The code uses simple thresholds to classify the air quality into descriptive categories:
- Less than 181: GOOD
- 181 to 225: POOR
- 226 to 300: VERY BAD
- Greater than 300: TOXIC
Note: These thresholds are illustrative. Calibrate the sensor in a known clean-air environment and adjust thresholds based on empirical measurements.
Key Learnings and Practical Challenges
Sensor Calibration is Crucial
Problem: The MQ135 gas sensor does not provide accurate readings immediately after being powered on.
Learning: The sensor requires a significant warm-up period (often 24–48 hours) to allow its internal heating element to stabilize. For best results, thresholds should be calibrated in a known clean-air environment.
Hardware Quirks Matter
Problem: The OLED display might fail to initialize even with correct wiring.
Learning: I2C devices have a hardcoded address. While the default for many OLEDs is usually 0x3C, some batches use 0x3D. Check component datasheets and use an I2C scanner sketch during troubleshooting.
Future Enhancements
- Connectivity: Add Bluetooth or Wi-Fi to send data to a smartphone app or cloud service.
- Data Logging: Incorporate an SD card module to track air quality trends over time.
- Expanded Sensing: Integrate additional sensors for CO2 or PM2.5 measurement.
- Enclosure: Design and 3D-print a custom case for a polished, self-contained unit.
Conclusion
This Arduino Air Quality Monitor is a practical and rewarding project that demystifies environmental sensing. It combines hardware integration, sensor data processing, and a user-friendly display into a low-cost, functional device. The project demonstrates how accessible microcontroller platforms like Arduino can be used to create useful tools for everyday life.